Sales Are Growing. Why Is There Still No Cash?
A practical guide for Pakistani business owners and CFOs to understand cash tied up in receivables and stock, with a worked PKR example and a 13-week cash forecast.


It is Monday morning. The sales report shows another good month. Orders are increasing, the warehouse is busy, and the profit figure looks encouraging.
Then finance asks which supplier payments can wait until Friday. Payroll is approaching, a customer has postponed payment again, and purchasing needs an advance for materials.
How can a growing business be so short of cash?
For an owner, this is a frustrating question. For a CFO, it is a question the business needs to answer before the next commitment is made. My starting point is simple: sales, profit, and cash tell us different things. We need to understand all three.
Growth needs money before it produces money
An invoice can become revenue before the customer pays. Goods can sit in stock after the supplier has been paid. A factory can spend on materials and wages while an order is still in production.
The business has committed cash, but the money from its customer has not arrived yet. As orders grow, that gap can grow too.
For a trader, the gap may sit between paying for imported goods and collecting from dealers. For a manufacturer, it may include raw materials, production, finished stock, delivery, and customer credit. A healthy order book does not tell you whether those stages are funded.
That is why I would ask two questions about a large new order: “Will we make a worthwhile margin?” and “Can we fund the order until we collect?” Both deserve an answer.
A profitable month that consumes PKR 2.1 million
Consider this fictional illustration, with every amount in PKR millions. It is not a Gluon customer case or a forecast for any particular company.
A trading business increases monthly sales from PKR 10 million to PKR 12 million. Its simplified operating result is:
| Item | PKR million |
|---|---|
| Sales | 12.00 |
| Cost of goods sold | (8.40) |
| Operating expenses | (2.00) |
| Operating profit | 1.60 |
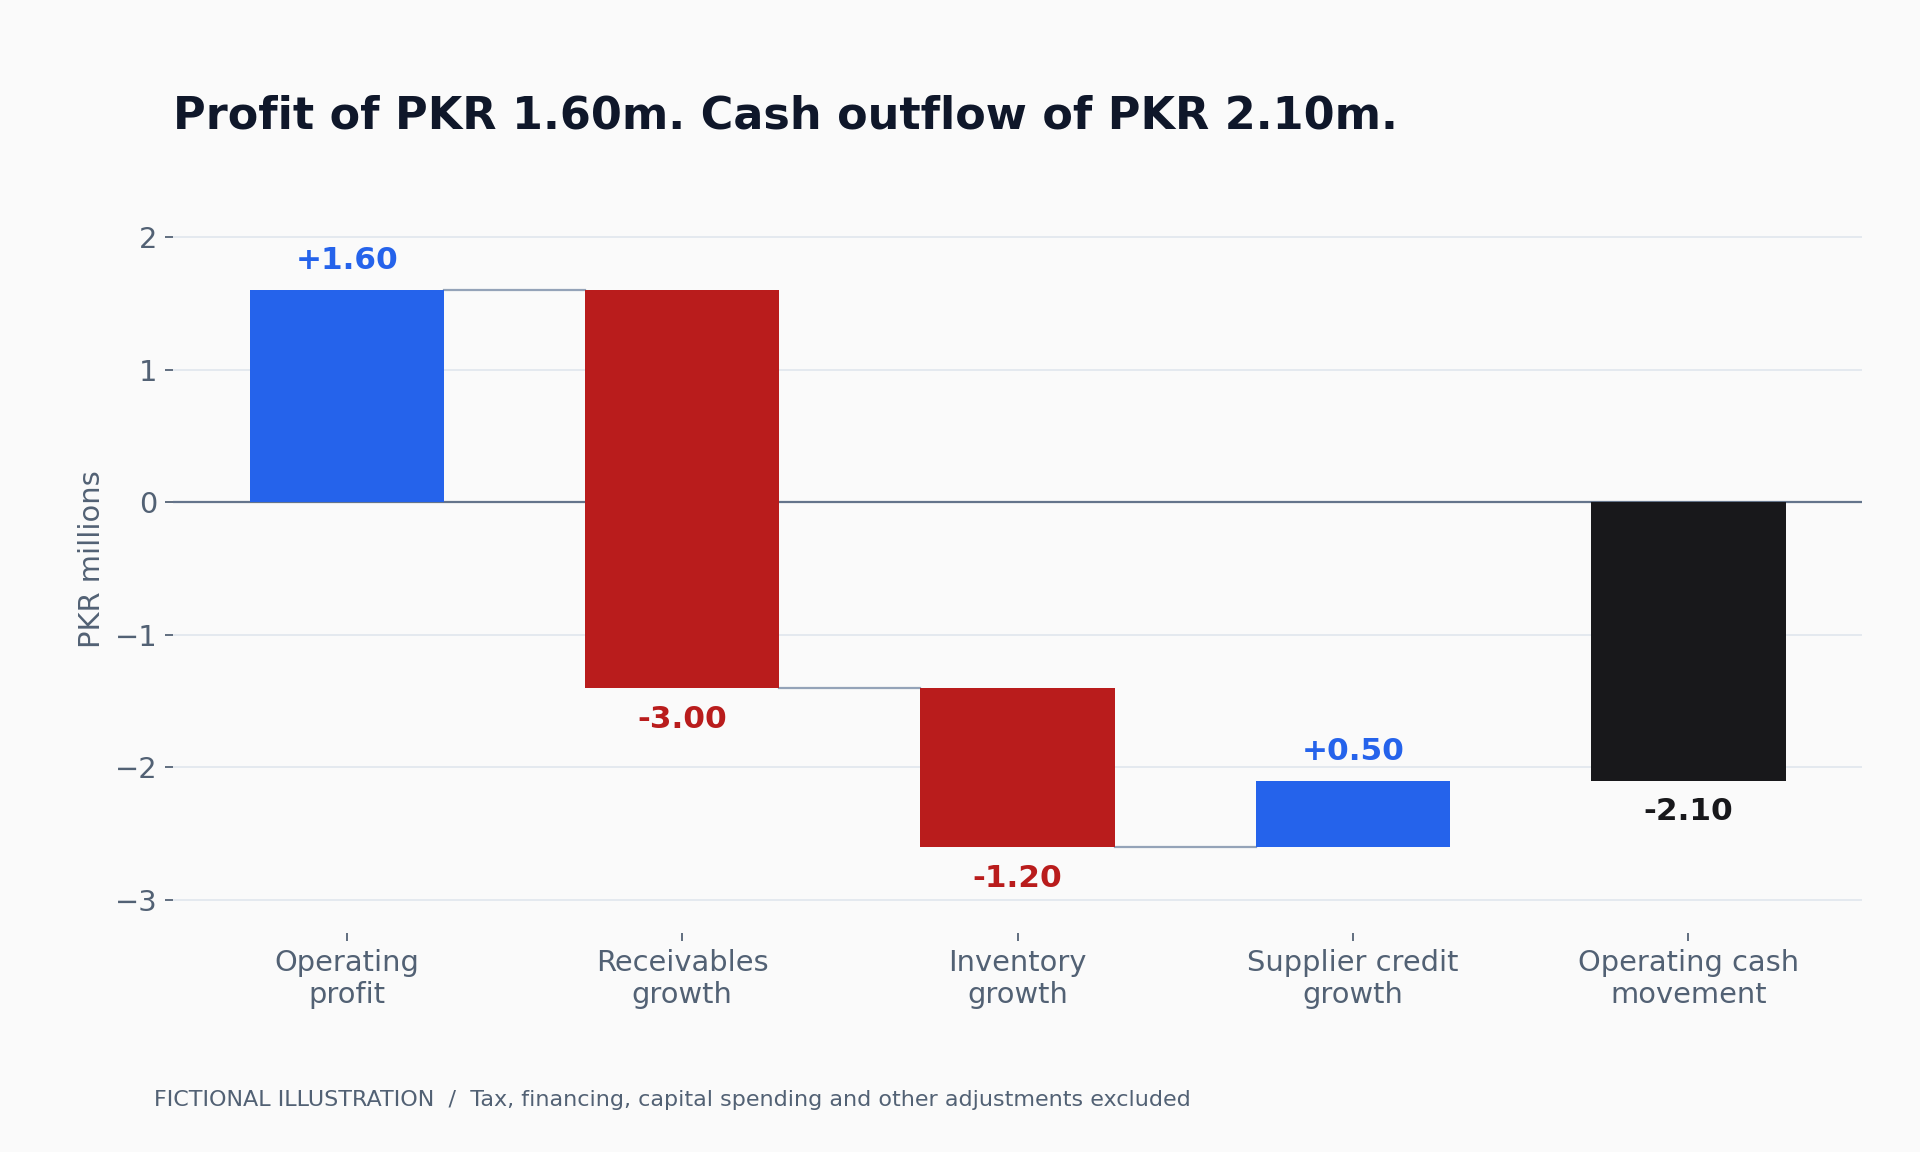
However, receivables increase by PKR 3 million, inventory increases by PKR 1.2 million, and supplier payables increase by PKR 0.5 million. Here is the bridge from that profit to operating cash movement:
| Adjustment | PKR million |
|---|---|
| Operating profit | 1.60 |
| Additional money owed by customers | (3.00) |
| Additional money held in inventory | (1.20) |
| Additional supplier credit used | 0.50 |
| Net operating cash movement | (2.10) |
The same result can be checked directly. Collections are PKR 9 million. Purchases are PKR 9.6 million, of which PKR 9.1 million is paid after allowing for the increase in supplier payables. Add PKR 2 million of paid operating expenses: PKR 9 million received minus PKR 11.1 million paid leaves a PKR 2.1 million cash outflow.
Opening cash of PKR 3 million therefore falls to PKR 0.9 million despite the profit.
For clarity, this illustration assumes all operating expenses are paid and excludes taxes, depreciation, borrowing, capital spending, and owner withdrawals. In your own business, reconcile those items too. The explanation must account for the full movement in cash.
Find where the cash is waiting
Start with customer balances. An ageing report should lead to specific questions: Is the invoice accepted? Is there a delivery dispute? Has a credit note been left unresolved? Who confirmed the payment date? “The customer usually pays” is a weak basis for next week's payroll plan.
Then examine stock. A large inventory balance can include essential materials, slow-moving products, and items bought because a bulk price looked attractive. Review quantities, consumption, commitments, and supplier lead times together. Cutting all purchasing equally can leave production short of a critical material while unwanted stock remains untouched.
Finally, look at supplier terms. Paying early without a worthwhile benefit may consume cash unnecessarily. Paying late without agreement can damage supply. Discuss terms before an order is placed and reflect the agreed dates in the forecast.
ACCA's working-capital guidance explains the cash cycle through inventory days, customer collection days, and supplier payment days. In a simplified example, 45 days in stock plus 60 days to collect, less 30 days of supplier credit, creates a 75-day cycle. Those are illustrative figures, not a benchmark for Pakistani businesses. Your product mix and trading arrangements determine the appropriate comparison.
Put the next 13 weeks on one page
A monthly profit report helps explain performance. A weekly cash forecast helps decide whether the business can meet its commitments when they fall due.
I would begin with a rolling 13-week view. BDC, Canada's business development bank, provides a cash-flow calculator with a 13-week forecast. The method is useful here too; the assumptions should come from your own business.
Use cleared, available opening cash. Enter collections in the week you reasonably expect receipt, supported by invoice-level follow-up. Enter supplier payments, salaries, utilities, taxes, instalments, and other obligations in their expected payment weeks. Show borrowing and repayments separately if applicable. Keep unused financing availability visible rather than treating it as cash already received.
The calculation is straightforward: opening cash + receipts − payments = closing cash. Each week's closing balance becomes the next week's opening balance.
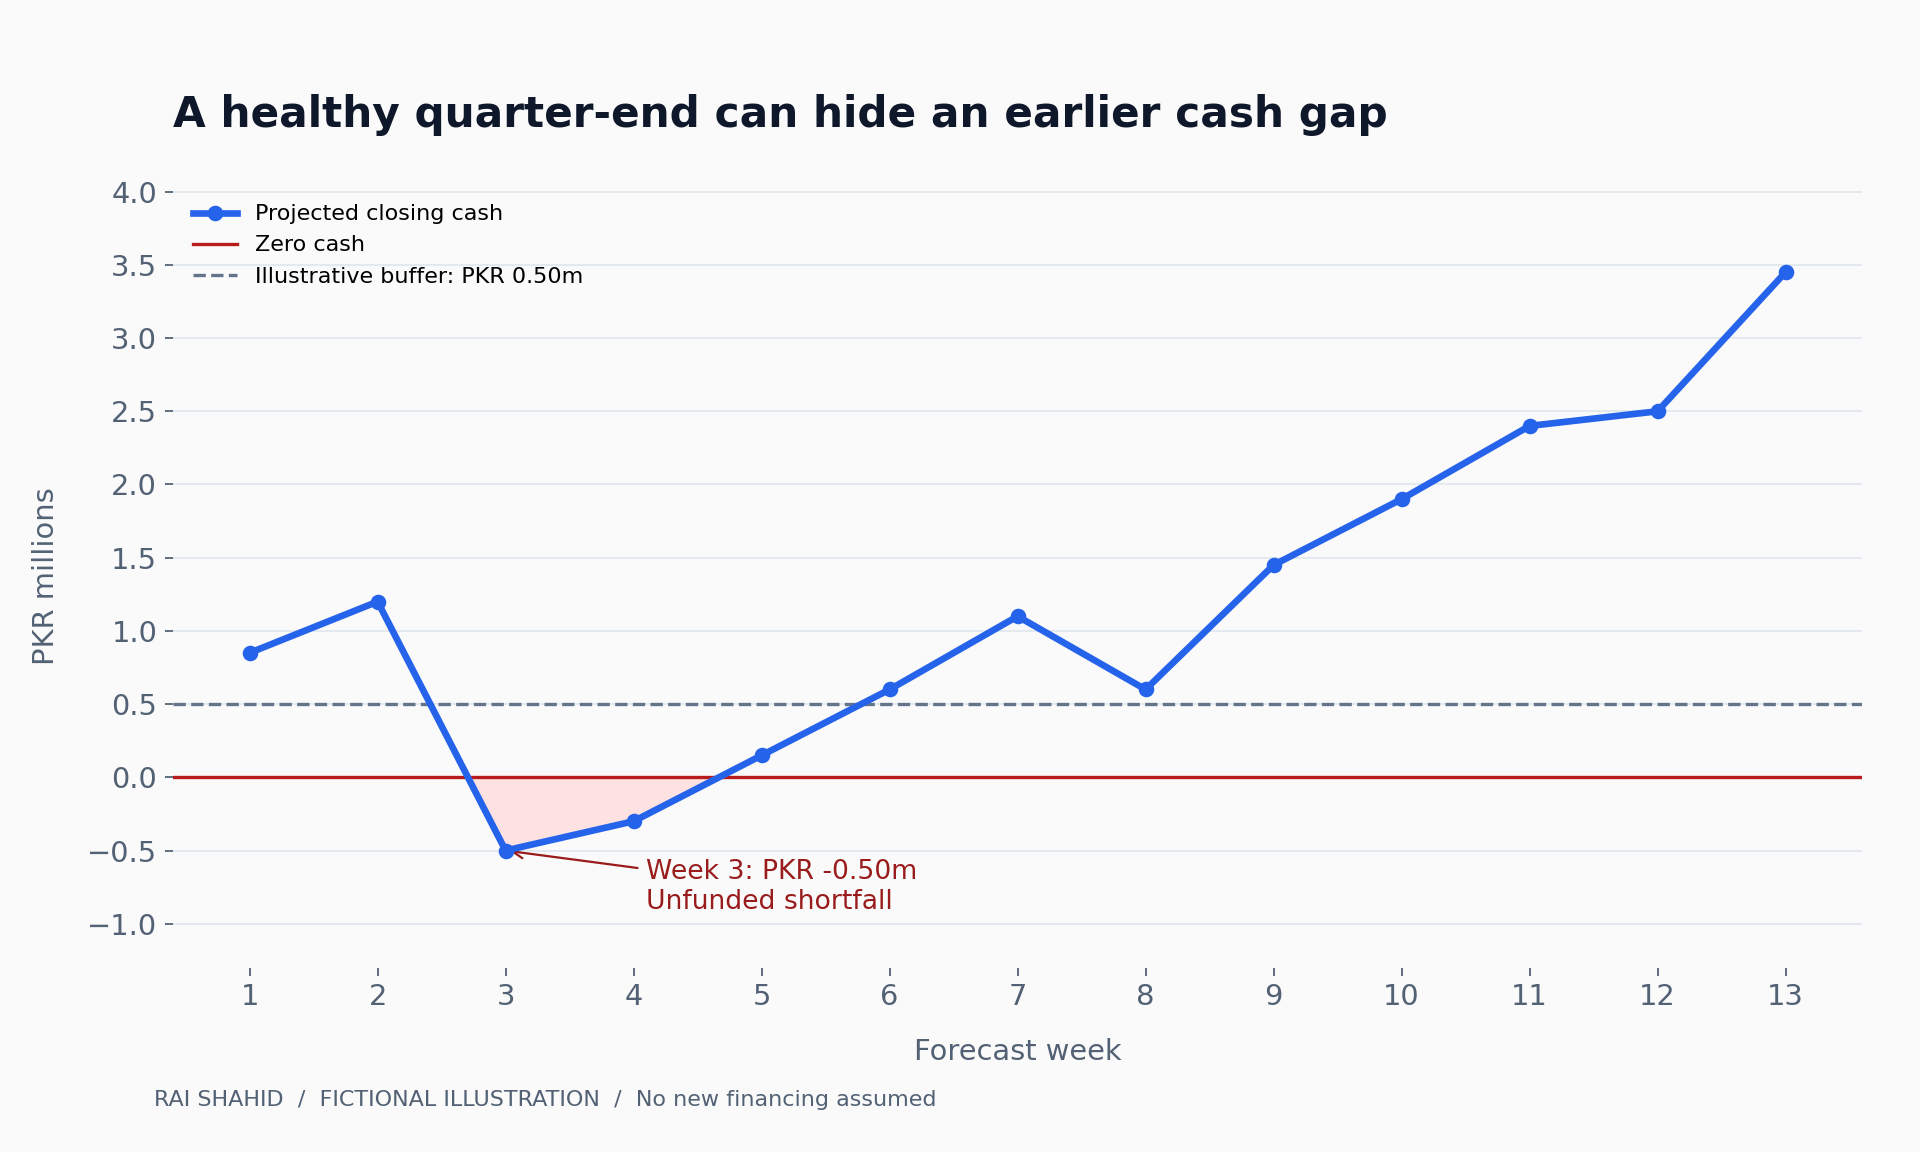
Here is a complete illustrative base case, continuing from the PKR 0.9 million closing cash above. Amounts are PKR millions; supplier payments and all other cash payments are shown separately. The large supplier payment in week 3 is a fictional committed purchase payment. No new financing is assumed.
| Week | Opening | Receipts | Suppliers | Other payments | Closing |
|---|---|---|---|---|---|
| 1 | 0.90 | 2.10 | 1.80 | 0.35 | 0.85 |
| 2 | 0.85 | 2.40 | 1.70 | 0.35 | 1.20 |
| 3 | 1.20 | 2.00 | 3.20 | 0.50 | -0.50 |
| 4 | -0.50 | 2.80 | 1.60 | 1.00 | -0.30 |
| 5 | -0.30 | 2.50 | 1.70 | 0.35 | 0.15 |
| 6 | 0.15 | 2.60 | 1.80 | 0.35 | 0.60 |
| 7 | 0.60 | 2.70 | 1.70 | 0.50 | 1.10 |
| 8 | 1.10 | 2.40 | 1.90 | 1.00 | 0.60 |
| 9 | 0.60 | 2.90 | 1.70 | 0.35 | 1.45 |
| 10 | 1.45 | 2.60 | 1.80 | 0.35 | 1.90 |
| 11 | 1.90 | 2.80 | 1.80 | 0.50 | 2.40 |
| 12 | 2.40 | 3.00 | 1.90 | 1.00 | 2.50 |
| 13 | 2.50 | 3.10 | 1.80 | 0.35 | 3.45 |
The lowest projected balance is negative PKR 0.50 million in week 3. That represents an unfunded shortfall, not cash the company can spend. A positive balance at week 13 does not solve a payment problem in week 3. Weekly totals can also hide a shortage within a week, so check daily timing around critical dates.
If management chooses an illustrative minimum cash buffer of PKR 0.50 million, the week-3 gap to that buffer is PKR 1 million. That is a planning requirement, not automatically a borrowing recommendation. Validate receipts, discuss agreed payment timing, assess discretionary purchases, and arrange any necessary funding before the shortfall arrives.
Download the illustrative forecast data as CSV to inspect the numbers. It contains fictional values; replace them with verified figures before using it for a decision.
Technology should make the discussion more precise
As a software engineer, I see value in connecting the forecast to the records behind it: customer invoices, purchase orders, inventory, payroll, and bank transactions. That reduces repeated entry and gives people a common starting point.
But an ERP due date is not proof that a customer will pay on that date. The forecast needs judgement as well as records. Keep the promised collection date, the responsible person, and the reason for changes visible.
AI can help summarise overdue balances, identify missing explanations, or draft collection follow-ups from approved records. Let verified calculations produce the totals, and have a responsible person review the assumptions. An attractive summary cannot make an uncertain receipt certain.
Make the owner and CFO review it together
Set aside twenty minutes each week. Compare last week's expected cash with what actually happened. Investigate the largest differences, update the next thirteen weeks, and assign actions with names and dates. BDC also recommends refreshing a rolling forecast each week.
Test a downside case: what if a major receipt arrives two weeks late? Keep the base and downside cases separate. A balancing entry called “additional sales” is not a solution unless there is a credible path from order to cash.
Include sales and purchasing in the actions. Sales helps resolve collection obstacles; purchasing helps align commitments with realistic demand. Cash discipline works better when it belongs to the business rather than only to finance.
What you can do this week
- Reconcile your available bank balances and identify any restrictions on use.
- Review the ten largest overdue customer balances with sales. Record the next action and a realistic collection date for each.
- Examine slow-moving stock and upcoming purchases together. Identify commitments that can be adjusted responsibly.
- Prepare thirteen weekly columns showing receipts, payments, closing cash, and your chosen buffer. Include the obligations omitted from the simplified example.
- Review the first shortfall with your CFO and the relevant department heads. Assign an action before approving further commitments that depend on the same cash.
Growing sales should give a business more opportunity. A clear view of cash helps you decide which opportunities you can support, what needs to change, and when to act.
All numerical examples and charts are fictional illustrations prepared for this article. Sources were checked on 25 October 2026.